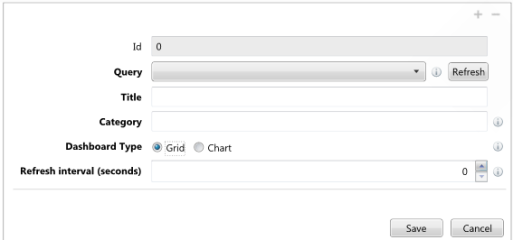
To create a chart within MiiNT the below information must be completed:
The table below list the fields for dashboard charts.
| Fields | Description |
|---|---|
|
Id |
The unique identifier of the dashboard chart, which is automatically generated when a record is created. This Id is used on the Dashboard Chart View page to display the chart. |
|
Query |
The report query that provides the data for the chart. |
|
Title |
The title of the dashboard, that will appear in the Dashboards – Administration list and when the chart is displayed. |
|
Category |
Set this to the page in MiiNT where the dashboard will be displayed. Refer to the Category topic for more details on categories. |
|
Dashboard Type |
Set this to Chart. |
|
Refresh interval (seconds) |
The number of seconds between the query automatically being refreshed. Note: There will be no refreshing when the value is set to 0. |
|
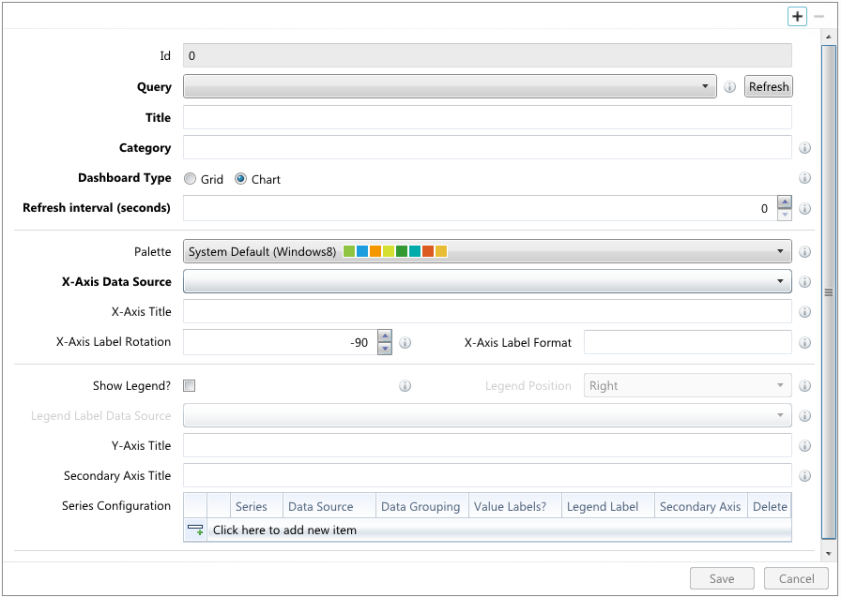
Palette |
Select the palette of the colours to be used in the chart or accept the Windows 8 System Default palette. |
|
X-Axis Data Source |
Select the output field from the report query to provide data for the X-Axis. |
|
X-Axis Title |
Enter the title to be displayed to the X-Axis of the chart. |
|
X-Axis Label Rotation |
Enter a value indicating the rotation angle for the X-axis labels. Useful when label texts are long, so they do not overlap each-other. |
|
X-Axis Label Format |
Enter formatting to be applied to the X-Axis label i.e. d-MMM for 7-May |
|
Show Legend? |
Select to display a legend on the chart. |
|
Legend Position |
Select the position to show the legend on the chart. |
|
Legend Label Data Source |
Select the output field from the report query to provide data for the legend label. |
|
Y-Axis Title |
Enter the title to be displayed to the Y-Axis of the chart. |
|
Secondary Axis Title |
Enter the title to be displayed to the Secondary Axis of the chart. |
|
Series Configuration |
This is where you configure the series to be used to chart the data. Note: It can be configured for more than one series. |
|
|
Click this button to add a new series. |
Note: Field labels highlighted as bold must have a value entered or selected as they are mandatory.
To create a chart series within MiiNT the below information must be completed:
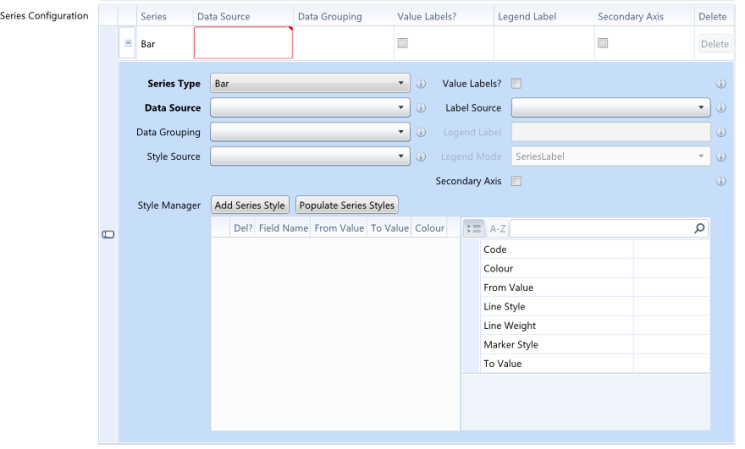
The table below list the fields for a series configuration of a dashboard chart.
| Fields | Description |
|---|---|
|
Series Type |
Select the type of series to be used to display the data on the chart. Refer to the Series Overview topic for explanation of the different series types and their use. This will default to a Bar series. |
|
Data Source |
Select the output field from the report query to provide data for the series. |
|
Data Grouping |
Select the output field from the report query to group the series data. For example:
Note: The field Name will be displayed in brackets when it is different to the field Description. |
|
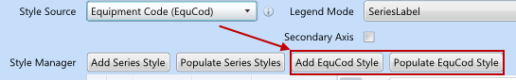
Style Source |
Select the output field from the report query to drive the style selector for this series. Note: Selecting a style source field will generate additional style manager buttons: Add <fieldname> Style & Populate <fieldname> Style.
In the above example the Equipment Code (EquCod) field has been selected to drive the style selector, resulting in the Add EquCod Style and Populate EquCod Style buttons being displayed. |
|
Value Labels? |
Select to display value labels for data points on a chart. |
|
Label Source |
Select the data to be used for data point labels. |
|
Legend Label |
Enter the name to be displayed for the series legend. |
|
Legend Mode |
Select the way to map the legend to the data series:
|
|
Secondary Axis |
Select this to show this series on the secondary axis of the chart. |
|
Style Manager |
Select one of the below buttons to create a style to add to the series:
|
Note: Field labels highlighted as bold must have a value entered or selected as they are mandatory.
The table below list the style manager fields that can be applied to a dashboard chart.
| Fields | Description |
|---|---|
|
Del? |
Select the Del? checkbox to delete the series style when the series is saved. |
|
Field Name |
The field name of the Data Grouping or Data Source to be used for the series style. If the series has data grouping applied a series style record for that field will be created, otherwise a series style record will be created for the data source field. Note: This field is automatically populated when you select either the Add Series or Populate Series Styles buttons. |
|
From Value |
Enter the start value to be applied to the series style. |
|
To Value |
Enter the end value to be applied to the series style. |
|
Colour |
Enter the colour to be applied to the series style. |
The table below list the properties that can be used for a style manager field.
| Fields | Description |
|---|---|
|
Details |
|
|
Code |
Enter a description for the style. |
|
Appearance |
|
|
Colour |
Select a colour to be used for the style. |
|
Line Style |
Select a line style to be applied to the selected style. |
|
Line Weight |
Select the width of the line. |
|
Marker Style |
Select the marker style to be applied to the selected style. |
|
Values |
|
|
From Value |
Enter the start value where for the selected style. |
|
To Value |
Enter the end value where for the selected style. |